
In this blog, we will talk about Greenup, Powerup and Speedup (GPS-UP), an easy to use energy metric that helps developers, students, and researchers understand not only the energy efficiency of their optimizations but helps them make better choices about what kind of optimizations they would like to make.
Background and motivation
In the past decades, industry and researchers have made substantial efforts and significant progress in improving the energy efficiency of hardware and facility infrastructure. However, the energy efficiency of software has been historically overlooked. In fact, the vast majority of today’s software developers either do not consider software energy efficiency at all or consider it merely as an after-thought (usually too late). When the room for hardware improvement is narrowing down, software energy efficiency will play an increasingly important role in further advancing green computing.
To improve software energy efficiency, we need a platform (e.g. Marcher) that can easily and accurately measure the energy consumption of various programs is necessary. We discussed this in a previous article. Equally important are metrics that can evaluate and compare the energy efficiency of software. Without good metrics, developers get confused and arguments may arise. For example, one can argue that energy efficiency is merely a byproduct of performance improvement because faster code tends to be more energy-efficient. Meanwhile, others can argue that energy efficiency and performance are conflicting goals. To reduce energy consumption, software performance must be sacrificed or vice versa. Both arguments are legitimate under certain circumstances but neither of them has revealed the big picture.
The physics of energy consumption and power
To better illustrate the problem, let us take a step back and look at the physics underlying energy consumption and power. The energy efficiency of software is affected by three things:
total energy consumed,
the time in which it was consumed, and
the rate it was consumed (power).
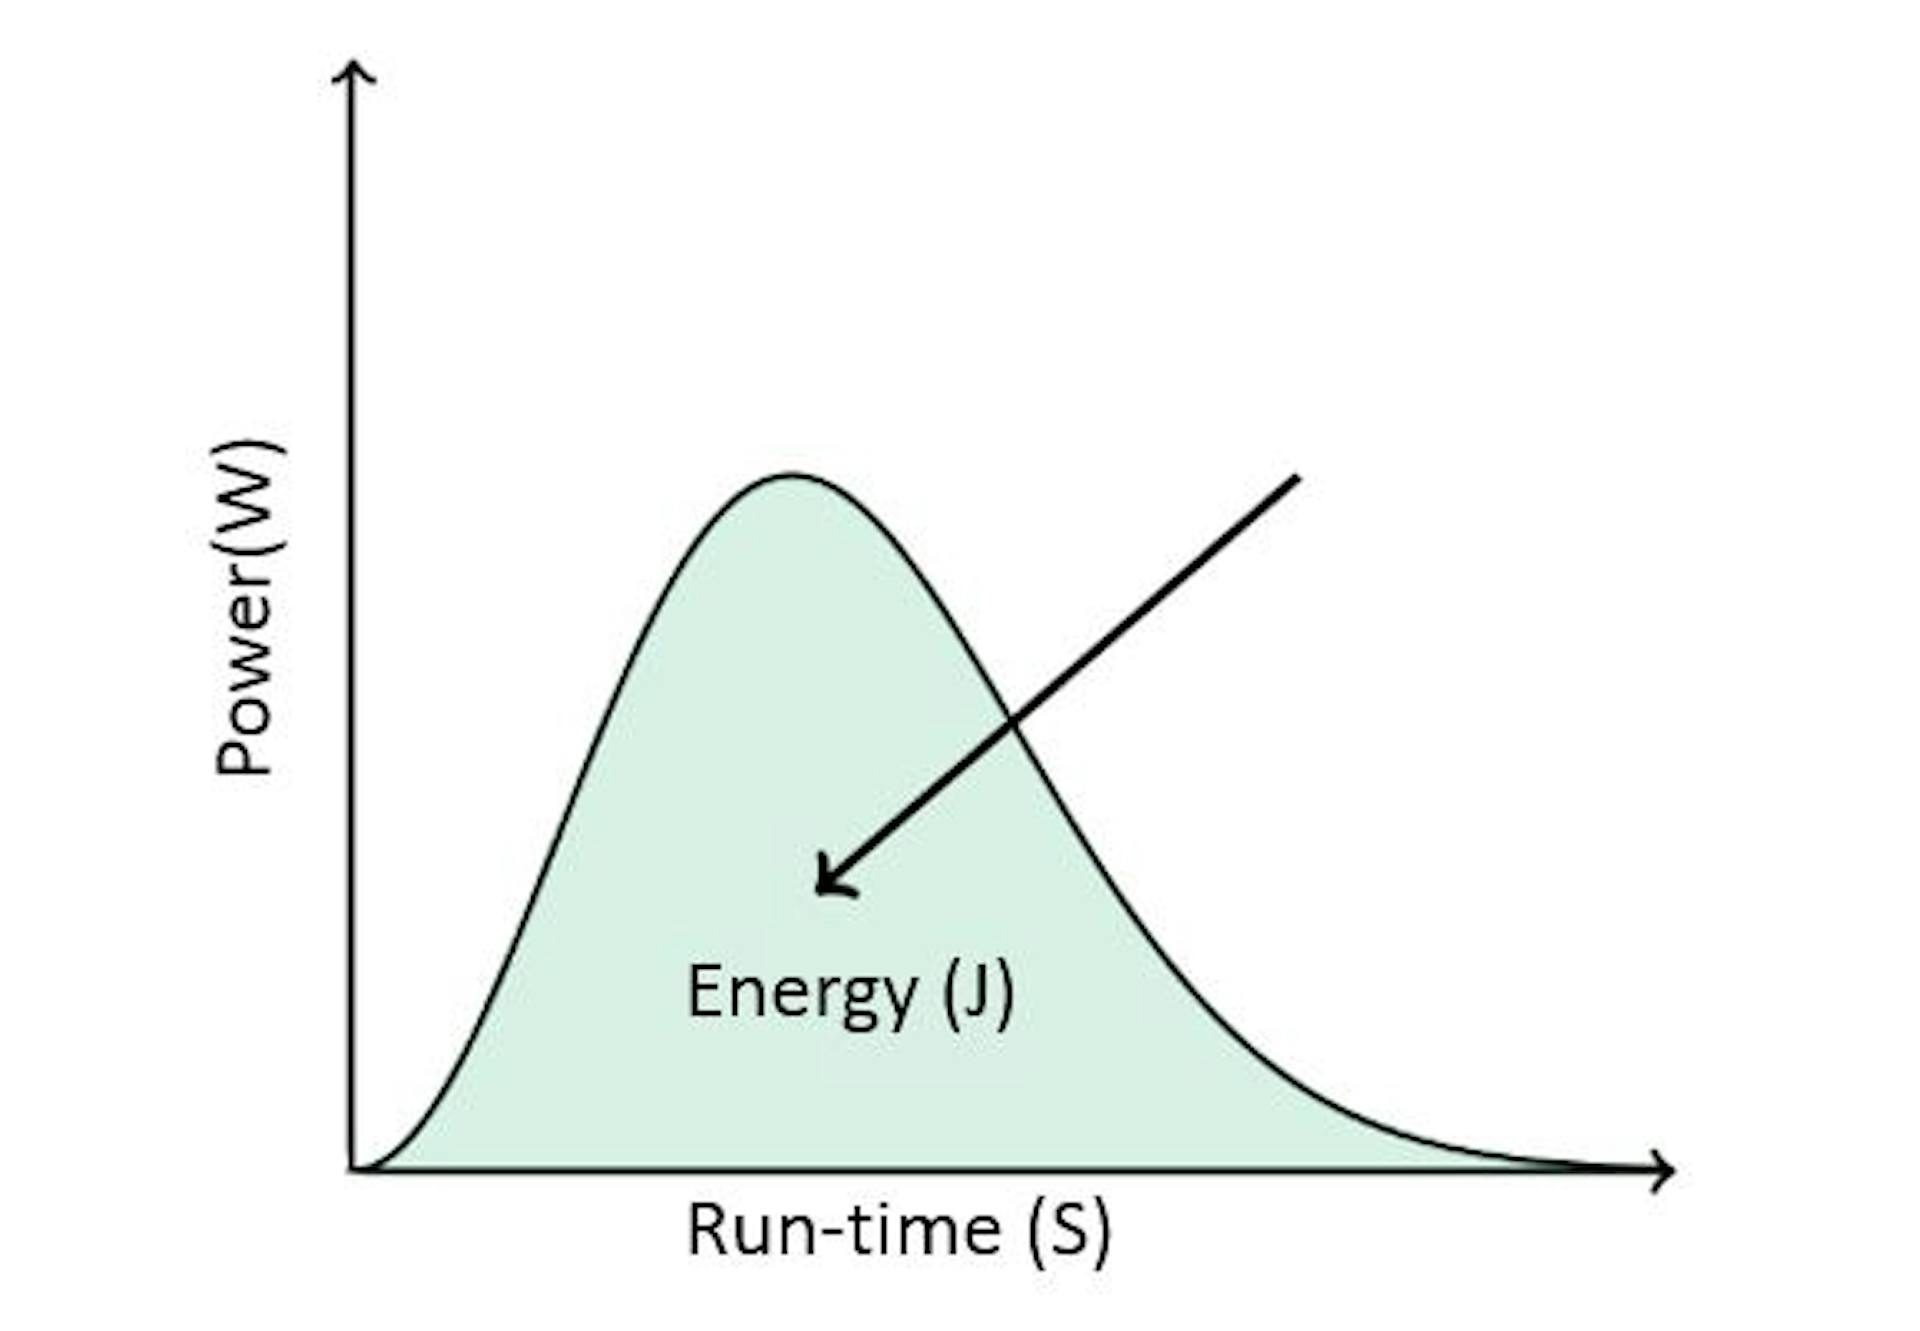
The units for energy, power and time are Joule, Watt, and Second respectively. A basic way to understand the correlations between performance, power, and energy consumption is that the energy consumed during a program’s run-time is the area under the curve of the power of the run-time of the program.


Energy Delay Product
There are very few existing metrics for software energy efficiency. Energy Delay Product (EDP) is the well-known one among them that considers both energy and run-time simultaneously.
Basically, EDP = Energy x Run-time.
EDP is certainly useful, but it is not adequate. Why is that?
Take the following hypothetical example. Suppose a code (before optimization) runs 100 seconds and consumes 20,000 Joules of energy.
Optimization 1 parallelizes the code and shortens the execution time to 25 seconds and consumes 10,000 Joules of energy. Optimization 1 runs 4 times faster but consumes 2 times more power thereby saving 2 times of energy.
Optimization 2 also parallelizes the code, but uses Dynamic Voltage Frequency Scaling (DVFS) to reduce the frequency of multi-cores. It runs for 50 seconds and consumes 5,000 Joules of energy. Optimization 2 runs 2 times faster but consumes half of the power thereby saving 4 times of energy.
Although, optimization 1 and optimization 2 have the same EDP value (250,000), they clearly belong to different categories. Optimization 2 improves energy more than performance and optimization 1 improves performance more than energy consumption. EDP cannot effectively distinguish the two optimizations.
Speedup, Powerup, and Greenup
So if EDP is not an effective tool for comparing the efficiency of two programs, what would be a better solution? Well, we need something that would give us multiple angles to evaluate the performance, power and energy. There are many ways to achieve energy efficiency gains like decreasing run-time, or decreasing power used for the same run-time.
In parallel programming there is a metric Speedup, which is defined as:
Sup = Tϕ /To
where Tϕ is the runtime of the baseline code and To is the runtime of the parallelized code.
Similarly we define a metric Powerup to be:
Pup = Po /Pϕ
where Pϕ is the average power of the baseline code and Po is the average power of the optimized code.
Here, note that the optimized code goes on top. This gives us a ratio, so if the Powerup is greater than 1 the new code has a higher average power. That is often the case with parallel programs as they utilize more cores.
The last and most important metric we will introduce is what we call Greenup:
Gup = Eϕ / Eo
It is worth noting that, because the energy for a program is the product of the runtime and the average power consumption:
Gup = (Tϕ × Pϕ ) / (To × Po) = Sup / Pup


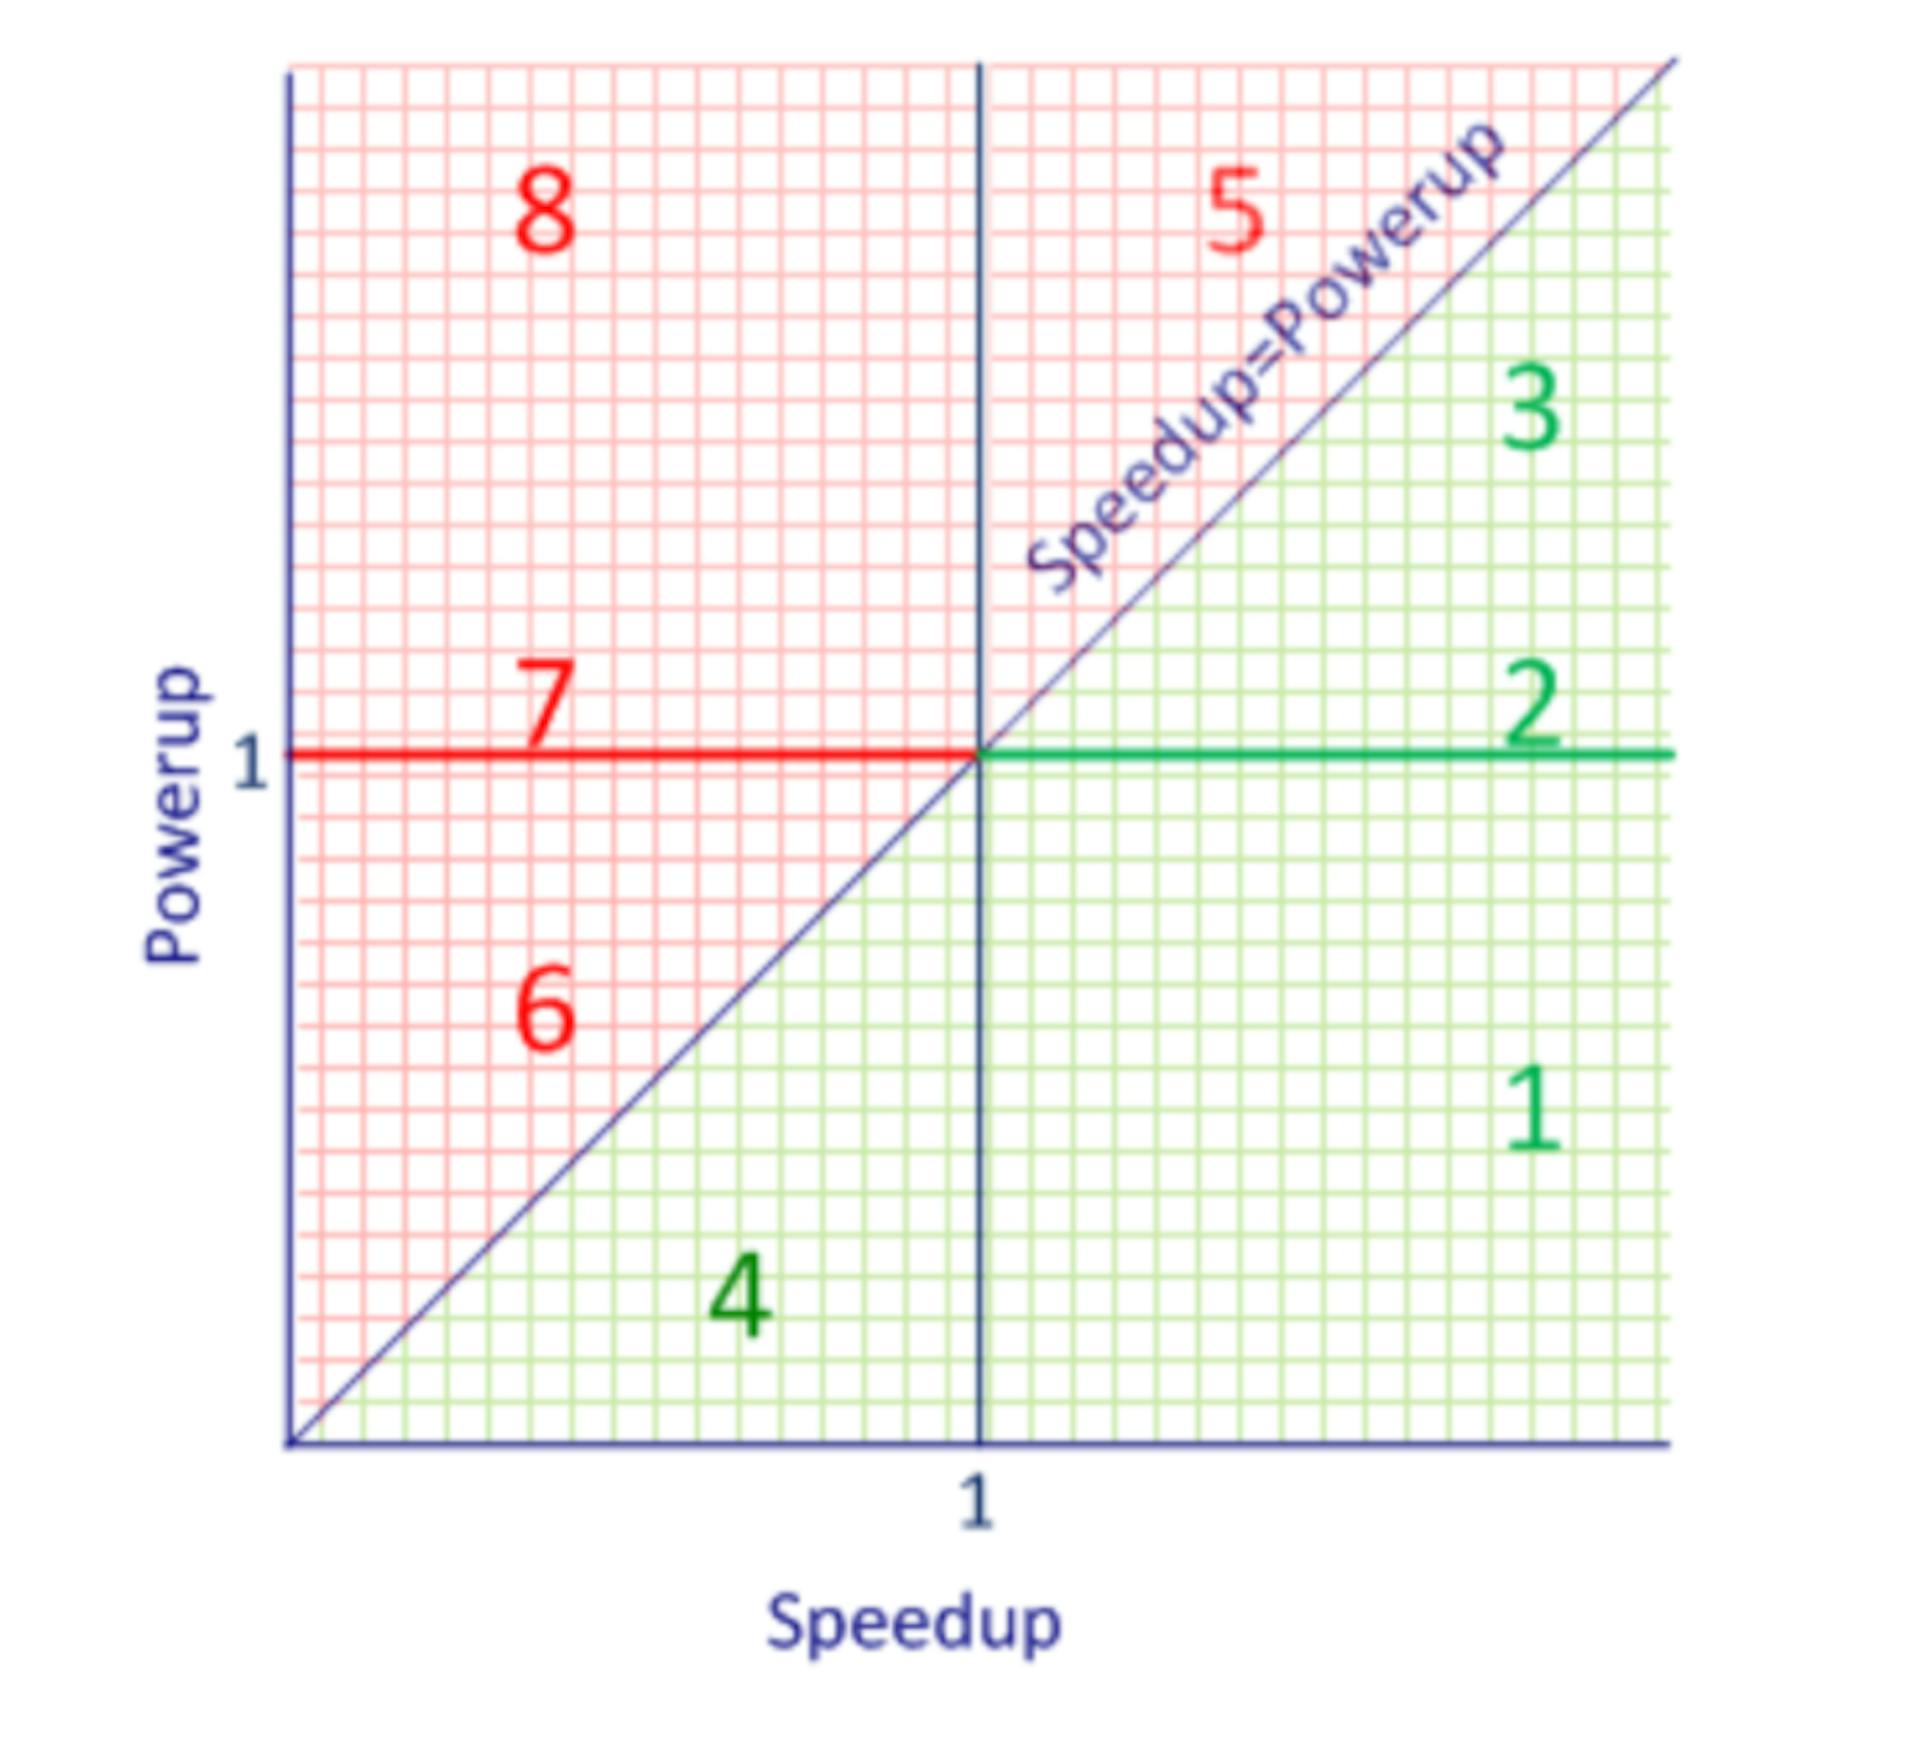
With Speedup, Powerup and Greenup, software optimizations of all kinds can be categorized into one of the eight quadrants, as shown in the above graph.
Interpretation
The quadrants in green color indicate that optimizations can save energy.
The red quadrants indicate that optimizations actually consume more energy.
This graph covers all possible scenarios and reveals the big picture of software energy efficiency.
Category 1 represents a type of optimization where you are using less average power and seeing Speedup. This is the ideal case, and it is often the result of optimizations like making better use of cache to avoid main memory access.
Category 8 represents the opposite. It is pretty much the worst thing you can do, invest in more power but the program runs slower.
Category 2 on the horizontal axis represents optimizations that have no effect on power but decrease overall run-time. This class of optimization is often found from improvements of serial code. That is, the energy gain is purely from performance gain.
Category 7 indicates that the modified version of code consumes the same power but degrades performance.
Categories 3 and 5 represent cases of higher power compared to the baseline code. These often represent two scenarios of parallelizing serial code. Either the increase in Speedup helps the program finish fast enough that it results in energy savings as in section 3, or the extra power does not lead to sufficient performance improvement thereby consuming more energy as in section 5.
Categories 4 and 6 represent cases of lower power compared to the baseline code. This is often the case when using Dynamic Voltage and Frequency Scaling (DVFS) to reduce power consumption by a processor.
Category 4 represents a program that runs slower because of DVFS but ultimately consumes less energy. Category 6 represents a program running slower but consuming more energy than the original program.
Recall the hypothetical example that the EDP fails to distinguish, optimization 1 belongs to category 3 while optimization 2 belongs to category 1.
Want to test your own code?
If you would like to test your own code to see which category your optimizations fall into, you can run your programs on GreenCode, which has built-in abilities to calculate Greenup, Speedup, and Powerup between two versions of programs, as shown in the picture below.
If you would like to see examples for each category and learn more about the GPS-UP metric, you can read our paper: Using the Greenup, Powerup, and Speedup Metrics to Evaluate Software Energy Efficiency.
Originally published in the GreenSoft, Texas State University